Copyrights(c) 2010, Dr. R. R. Stiffler
Spatial Energy Coherence
Copyrights(c) 2010, Dr. R. R. Stiffler
Last
Update: 11/15/2010
|
CAPTRET A close look at this device This circuit was presented at Energetic
Forum by and unknown person
Normally I do not take the time to look at other devices do to my own research workload, although I made an exception here because I did some work very similar in 2008 called ESEG. ESEG did utilize electrolytic capacitors in a very similar way and produced very interesting results when properly driven by SEC Exciters. Therefore I decided to see what all the buzz was about and if there was anything to the strange and simple circuit. The first a most basic circuit I tested is shown on the following diagram. |
Fig: 1

|
The circuit consists of a SLA or solid lead acid battery of 12 volts, a 10uF/35V Electrolytic capacitor and a Red LED. The circuit was connected as shown in the above diagram and does indeed produce a decent amount of light from the LED. Actually my first try did not work because I connected the battery positive to the capacitor can (all other polarities were indeed matched) and the LED did not light. When I again looked at the simple diagram that was taken from the Internet I found that I had indeed made a polarity error. Access to the capacitor can is obtained by removal of the insulating plastic and a large clip can be used to attach a connection. At once my interest was stirred as I began to wonder why the circuit was so polarity sensitive. Initial Test Parts List: Battery B1 - SLA measuring 12.22V (measured
in operation as shown in Fig:1. |
Capacitor
Measurement: (Capacities)
Fig: 2

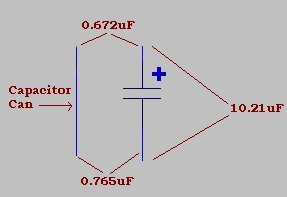
| I first explored the capacitor itself in order to better understand why the circuit was working. I measured the capacitor in three ways to determine the structure and what might be seen by the circuit. Each capacitor lead (active terminal +/-) was measured for capacity to the metal can housing the capacitor. The last measurement was the capacitance of the capacitor itself. The values obtained are shown in Figure 2. |
Capacitor
Mesurement: (Resistance)
Fig: 3

|
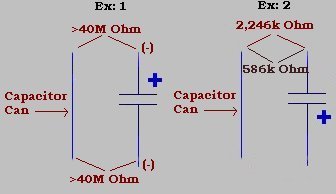
What I found in the capacity measurement of Figure 2, was that there was a small capacity from both the positive and negative plate materials and that a direct metallic connection did not exist between the capacitor can and either one of the capacitor plate structures. I did go further and look at resistance measurements. I must be noted that the values I obtained are dependent on the meter being used to measure the values as the meter circuitry will set the change in R/Dt as the various capacitances charge from the meter. What appears telling in what may be taking place is the resistance readings shown on Figure 3. There is present an unequal resistance between the can and the two plate areas of the capacitor which is polarity determined by the meter leads and the polarity of the measurement potential. In fact it appears that between the negative lead of the test capacitor and the containment can we see evidence of diode properties. There exists a very well defined difference in measured resistance dependant on measurement polarity. Again I must note that these readings will change over time as the charge is built from the measurement device. |
Fig: 4

|
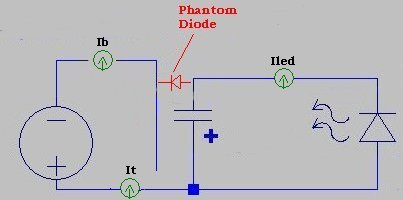
I will call this diode effect a 'Phanton Diode' or 'Phd' and is most likely a chemical effect of the capacitor electrolytic and internal materials. Because the diode effect is present in the polarity indicated I have drawn in Figure 5 what the circuit may indeed look like. |
Fig: 5

|
With the Phd in the circuit we can see why the operation is polarity sensitive as found when I first connect the circuit. Next step wat the taking of some actual measurements during operation of the circuit. Vb = 12.22V Battery Voltage |
Fig: 6

|
A current meter was included in the negative lead of the battery, which connected to the can of the capacitor and is labeled Ib. Current readings were also taken at Iled and It. Refer to Figure 6. What is seem is an initial surge current as the capacitor charges through Phd. Note that this surge is of course rather small because of the value of the capacitor and the resistance of the Phd. Once the capacitor reaches a point where the forward voltage of the LED is met, the LED begins to conduct and produce light. As expected Ib is the sum current of the charging of the capacitor and the LED current once conduction begins. Iled is only the LED current during conduction and It is the sum of the capacitor charge current and the resulting LED current Iled. The current It is the sum of the charge current and the LED current and equals Ib. Calling the capacitor charge current D IcwehaveIb=It=DIc+Iled Further it must be noted that the forward voltage of the LED clamps the maximum voltage presented across the capacitor and will very across LED types. For example a Red LED may have a Vf range of 1.5->1.7V and a White LED may have a range of Vf from 3.2->3.7 volts. The LED acts as a voltage regulator and holds the capacitor voltage to the LED's Vf value. One point to understand with this circuit is that the resistance of our 'Phantom Diode' or Phd changes and is not fixed, therefore we have a number of interactive and interdependent components to be aware of in any measuring of operational values. In the following circuit diagram the red box represents our 'Phantom Diode' and the varying forward and reverse conductance it is subject to. Fig: 7
I observed a variation in Ib1 over time and I feel this is a result of a change in the R1 do to temperature changes in the LED and capacitor. This did at times appear as a small oscillations of varying frequency (VLF) and could be a result of the Vf of the LED changing and causing an up and down cycling of the capacitor charge and R1 combined.. After looking at this for a few hours I see nothing that presents itself as an Over Unity device, or that it display any abnormal operation. The following Table and Chart so data to support this observation. The following Table was created using an expired 9-volt Energizer (6LR61, size 522). The battery was removed from service 9/12/2009 and was shelved until this test. The capacitor and LED were the same components specified in the preceding 'Initial Test Parts List'. Table: 1
LED Voltage Over Time Graph: 1
Battery Current Over Time Graph: 2
Long Time Period Battery Voltage Graph: 3
After a ten-hour run and seeing noting out of the ordinary I terminated the test and did a re-measure of the capacitors capacity. I was concerned that using the capacitor in this way may alter it characteristics. The capacity measured at 10.23uF, a negligible difference from the 10.21uF initially measured in Figure 2. I found no evidence at all that this circuit is charging its source battery. As stated in my test results there is present the initial surge current which is reflected in the battery and may reduce the battery voltage a few thousandths or hundredths, yet the so called charging is only normal battery bounce back. I also was able to at all-times monitor the Ib or battery current and even though it could be low as determined by the LED and the internal leakage of the capacitor was never found to be non-existent as claimed by some. My current conclusion is that the artifacts seen by the people reporting strange results are not properly measuring or are measuring with equipment that is incapable of presenting accurate results. Additionally whenever a device like this is released there appears to be a mass hysteria that results from erroneous theories and inaccurate measurements. Regretfully many people working with capacitors do not understand the most basic principles of a capacitors operation. I found in many of the reports on the Internet about this circuit to be lacking in even a basic understanding of charge and discharge curves. Along with this first observation I also see where measurement methods are incorrect or inconsistent and often times with equipment that is in no way capable of being used for accurate circuit measurement. Sadly the buzz seems to generate from qualitative analysis rather than quantitative. 11/15/2010 Potential Danger with Captret Circuits After a number of long term (48 hour) test runs with the most basic Captret circuit at various currents, I discover a Potential Danger from exploding and short circuiting capacitors running at higher current levels. Additionally when the capacitors began to gas internally the capacitors capacity changed greatly. The following photo's show what happened to a test capacitor running at milli-ampere levels for 48-hours. The circuit was powered with a 12-volt SLA and was about to short or blow the container. Shorting the 7-ampere hour battery could have resulted in a fire or personnel damage. Photo 1
Photo 2
Photo 3
Photo 4
At this point it appears that the capacitor electrolyte when biased in such a way allows the formation of a battery inside of the capacitor itself and as the chemical action takes place it produces gas much as it would when exposed to higher than rated voltage and or current. It was noted that although that noe of the damaged capacitors overheated. |