|
During my research into hydrogen production using
a distilled water{1} electrolyte, I noted
something I considered strange during a series of tests covering
the point in time at when H2 gas first started forming
on the cathode. I was not interested in the voltage or current at
which formation began, rather I wanted to know if the gas
formation started uniformly over the entire electrode or if it
started at a specific location or locations alone the length of
electrode. I had noted for some time that initial production was
not uniform, although at first my assumption was the observation
was possibly due to surface imperfections of the electrode
itself. I must note that I was indeed taking into consideration
the potential effect of V/cm, which appeared inadequate in
explaining the time lag involved for the entire electrode to
become part of the overall gas production.
Once gas production was fully involved on an
electrode, it became extremely difficult to determine if symmetry
of release existed. My objective in looking closer was to
determine if the electrode geometry could in some way affect the
overall gas production and efficiency. In short would a specific
electrode shape allow for an increase in overall production
efficiency?
My first observation was made using a
Carbon (Graphite){11} rod for the cathode and a
Copper circular screen for the anode. It should be noted that my
interest was not in the impact of using Copper in the test cell
(Cu is not recommended because of chemical reactions it takes
part in during electrolysis). This arrangement was used primarily
for convenience and did not affect my conclusion. The test cell
is shown in the following photo, the cell consisted of a 150 mL
lab beaker filled with ordinary tap water (not my normal
distilled electrolyte) and electrodes as described above.
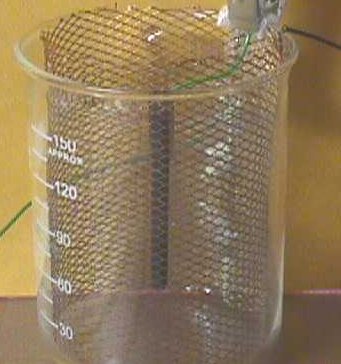
The beaker was filled to just 2 mm below the top
of the carbon{11} electrode. Once filled the
beaker was allowed to sit without a cover for 30 minutes before
testing, allowing for the contents to temperature stabilize and
some degassing.
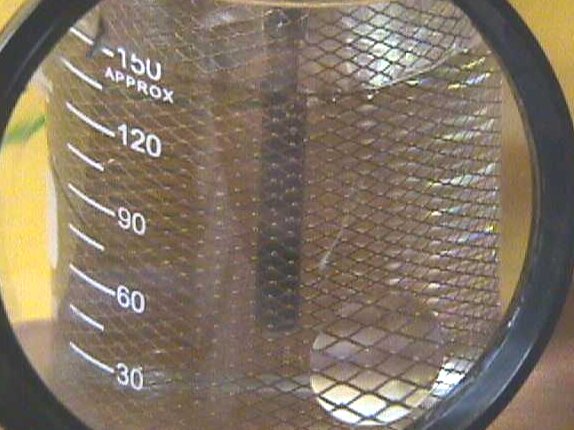
The test was quite simple in nature,
start applying voltage in discreet steps while observing the
carbon cathode with a 4X magnifier for the first sign of gas
formation. The setup is shown in the following photo.
The following conditions were not taken into
consideration during my tests because they would not have a
direct impact on the results, primarily because any contribution
from these factors would be easily observable; ambient
temperature, cells temperature, offset if any in the distances
between the anode and cathode.
The period of each test was short enough that
temperature layers did not form. Repeated tests were conducted
with a new liquid sample and new electrodes.
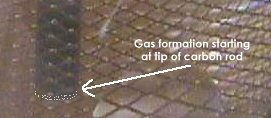
The following photo (plus simulated
gas bubbles, as the initial bubbles were to small to be
photographed) shows the location on the carbon rod where gas
formation first begins. The initial bubbles are small and start
spreading rapidly up the rod as the process continues.
A model we developed attempting to
explaining our first observations..
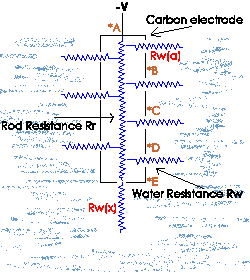
First consider the carbon rod from an electrical
resistance point of view in free space, if we started measuring
the rods resistance from point *a (our reference point) checking
at evenly spaced points (*b,*c,*d) and ending at *e, we would see
an increasing resistance over the rod length and
point *E, the end of the rod, we would measure the highest
resistance. Using this view and considering only resistance, one
might think that the top most point of the rod or point *A would
be the most vigorous point for gas production if the rod were
considered an infinite number of resistors in parallel.
The resistance at point *e on the rod
now becomes Rt = 1/(1/R(A) + 1/R(n)...
). What has happened is we now see a total reversal in
resistance, point *E is now the lowest and point *A is the
highest. Therefore under this set of conditions we would have the
highest available current at point *e (very tip of the rod) and
the least available current at point *a.
With this view in
mind the question raised is; Could increased gas production and
or efficiency (while holding cell input constant) be obtained by
proper selection of different electrode geometries? Currently
plates, disks and rods are standard shapes used for electrolyzing
electrodes, but are these efficient designs? We think not and
have experimentally demonstrated that different electrode
geometries do indeed have significant effect on gas production
efficiency.
After testing with rods, plates and disks it did
not take long to envision what would be the most efficient
electrode shape, a solid conductive sphere.
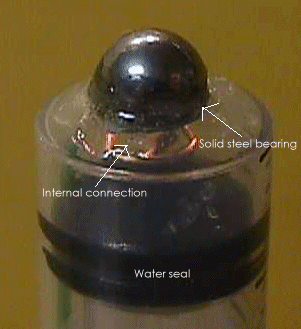
To confirm this I performed a test with a steel
ball bearing fastened with epoxy into a plastic syringe so that
approximately one half of the bearing surface was exposed to the
electrolyte. A pressure connection was made inside of the syringe
so that only the steel was exposed. The following photo shows the
test configuration.
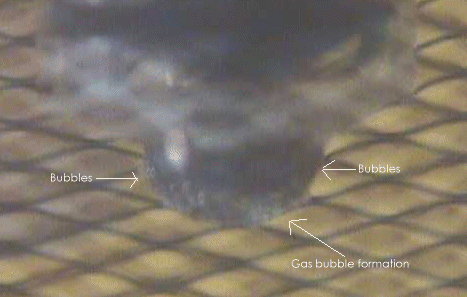
The same test procedure was used where
the voltage was increased in steps from zero until the first
indication of gas formation. We were able to capture this event
as shown in the following photo, because the bubbles were much
larger and almost covered the entire area of the exposed steel
bearing instantaneously. Granted, the surface (exposed area) of
the steel ball is much smaller than the total surface area of the
initial carbon rods, therefore the voltage potential per
centimeter is indeed higher, yet we later confirmed that the
shape was indeed advantageous over different shapes containing
similar exposed surface area.
The
theoretical optimum electrode would be a solid conductive
sphere{2} where the driving voltage
could be supplied at the exact center (core) of the sphere. The
following graphic shows why this is the ideal shape when looking
at resistance distribution.

The ideal sphere would consist of an infinite
number of resistances in parallel from the center where the
voltage is applied. This would mean that every external point on
the sphere would present the same potential pressure as every
other point. This concept is very much different from what is
seen with rods, plates and disks.
Electrode geometry and material composition
additionally impacts gas bubble retention on electrode surfaces
and overall current density resulting from the insulated surface
area. When gas bubbles are retained (built up) on the surface of
an electrode, that surface area is temporarily removed (until
bubbles are released) from contributing to continued electrolysis
because the gas bubble is isolating that portion of the surface
from exposure to the surrounding H2O. This is observed
when input current is monitored and found to gradually build
until the surface of an electrode starts losing surface area from
retained gas bubbles, at which point the input current will be
observed to begin to decreasing and continue to decrease as
additional surface area is removed from participation in the
reaction.
One might think of a number of ways in which to
dislodge these retained gas bubbles, although the more common and
easily implemented methods do present a down side to what should
be beneficial. Two possible methods (stirring &
re-circulating) the H2O electrolyte.
Indeed, stirring the H2O around the
area of the electrode does aid in the removal of gas bubbles from
the electrode surface and additionally breaks up the various
thermal layers built up within the cell, yet it also disrupts the
ion distribution around the electrode. Disruption of the ion
density around the electrode while knocking gas bubbles free will
temporarily cause a small spike in gas output and a decrease in
input current resulting from the disruption of the surrounding
ion density. Testing over a period of time has indicated that the
energy utilized in the stirring process when considered with
overall cell output actually causes a decrease in overall cell
efficiency rather than an expected increase.
Picking the proper feed point for rod electrodes
can produce a measurable difference in gas production. Observing
the direction of current flow may explain this difference. Two
rod electrodes fed from the same end, produce a smaller amount of
gas per reference input than two rods fed from opposite ends.
New Electrode design reduces cell heating caused by
ion collisions.
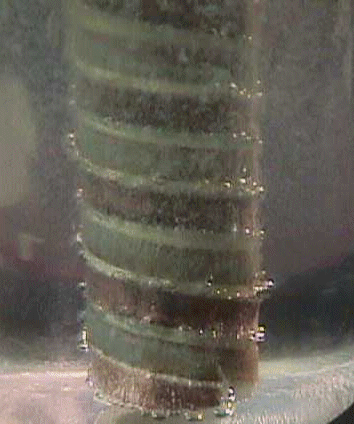
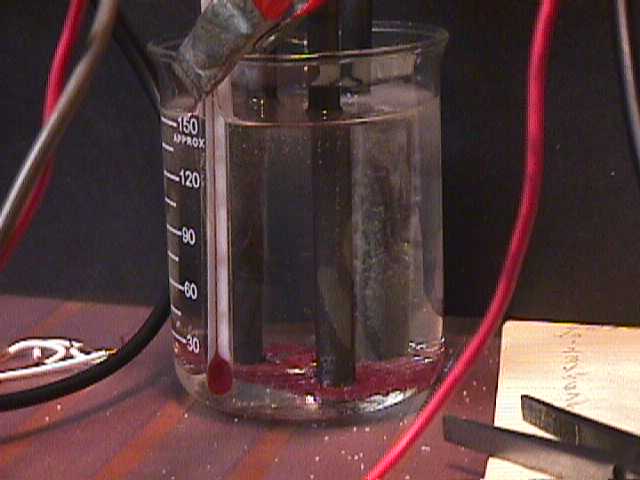
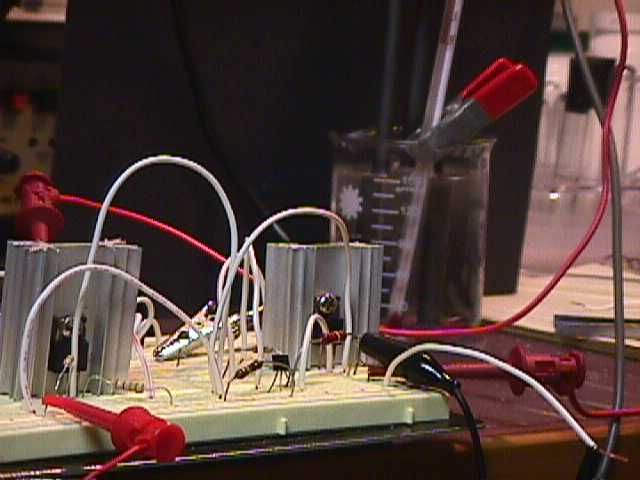
A new Barber Pole electrode
design coupled with CRE has moved On Demand
H2+02
(Single Duct, OxyHydrogen) another step
closer to reality. The preceding picture show Series
one experiments that use copper as the electrode material,
while later versions moved into Stainless Steel, Carbon and
Nickel for the active electrode surfaces.
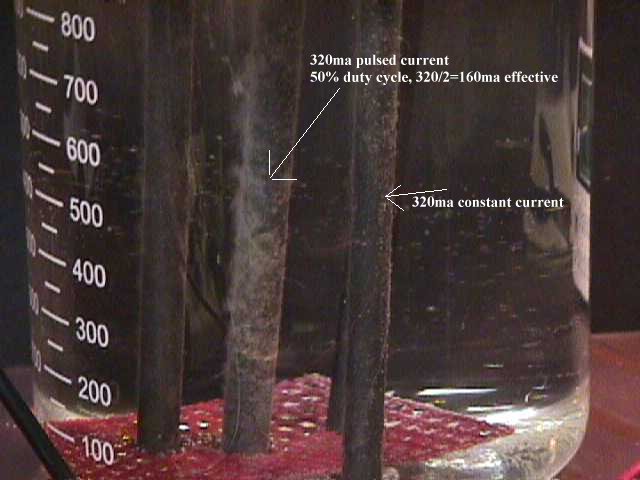
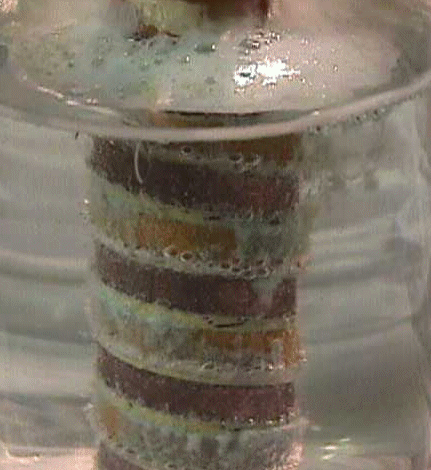
The following image shows the new electrode
design operating with DET (our proprietary additive) and the
vigorous gas release.
Electrode
feed point is critical for optimum operation.
My experiment involved a cell composed of two
carbon rod electrodes. The anode rod was fed from the top end,
which was out of the cell electrolyte and the cathode rod was fed
from its center (within the electrolyte). The following pictures
explain the obvious, all the gas conversion for the cathode is
below the feed point, while the end fed anode produces gas over
its entire length.
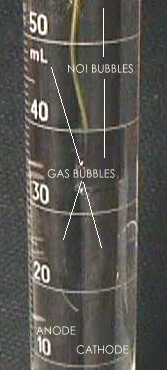
The preceding picture shows the two
rods and the yellow wire running down to the center feed point of
the cathode. The bubble action is indicated and can be seen
better in the following images.
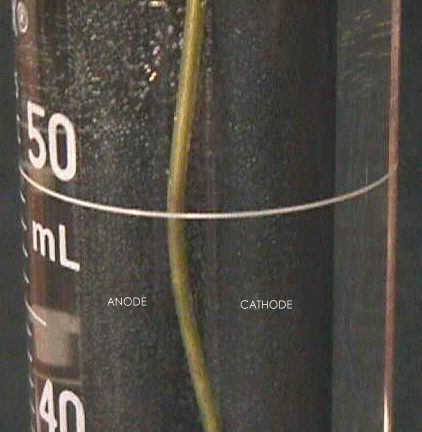
This next image shows the anode on the left and
cathode on the right. It is easy to see the O2 bubbles on
the anode as well as the yellow feed wire to the center of the
cathode. Note that there are no H2
bubbles on the cathode above
the feed point.
The following image shows the anode
and cathode below the feed point of the cathode. The bubbles are
indicated and the respective electrodes are marked.
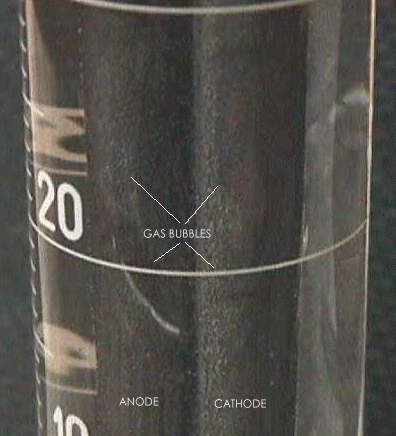
Fully one half of the cathode rod is
useless as it does not produce gas while the entire end fed anode
is producing O2. Without a doubt the way the
electrodes are fed is critical in the operation of the
electrolyzer.
The following image shows a depiction of charge
distribution around three different shapes. The circle is considered
to be a sphere.

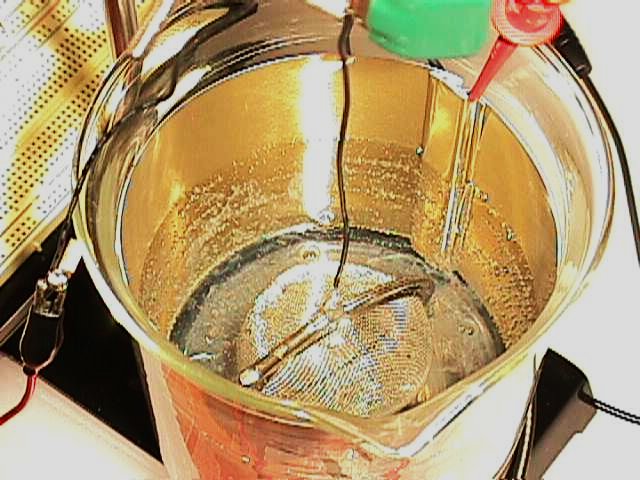
The following image shows a 1L beaker
with a Stainless Steel sphere for the cathode and anode of
anodized tin. In this series we measured H2 and O2
production at a rate of 2.13E-2 M/Hr with a pulsed
input of 12.9 volt peak at a 50% duty cycle driven by a CRE switche.
*Note It was
found through many hours of experimentation that there is one and
only one way to determine cell efficiency and that is to measure
the actual production gas volume. It does not suffice to measure
consumed power withing the cell. The consumed power is a valid
parameter in overall efficiency, yet you need to measure gas
output as you vary test parameters. When you find a maximum point
of gas production, then compare cell power (input) with output.
This is a critical fact when you are working with pulsed cells.
Measuring gas volume is not an easy task and requires the storage
of a quantity of gas for a period of time, which presents a
dangerous set of conditions. A limitation on the measurement of
evolved gas it that it does indeed contain water vapor. In order
to obtain fairly accurate measurement, it is recommended that a
Dryer be used, in this way a significant amount of water vapor
can be pulled from the gas mixture. Saving or storage of gas
is not recommended unless you have the proper equipment and
follow strict safety procedure.
C2E2 -
'Charge Cascading Excitation Electrolysis' using Inductive Coupled
Excitation
Having received a number of inquires regarding the
electrolyte used in our various tests, the following is an
enhanced explanation.
I normally use a distilled
water{1}
which is further processed by 'Ozonation', a process that exposes
the water to Ozone to aid in bacterial elimination. This process
is not required by our testing, yet is a process that is
automatically done by our water supplier. We do not produce in
lab distilled water for our testing because we have always felt
it necessary to use water that could be readily available to the
general public for a reasonable price of less than $1.00/gallon.
All water used in our tests (the distilled, treated
water) is degassed for a period of twenty four hours at 500 mmHg.
We do from time to time use a 'Wetting' chemical, a chemical
which aids in the management of water tension. Surface tension
is not of concern, yet the clumping of or large clumped water
molecules will evolve higher gas volumes if they are broken down
to smaller molecule structures. Our primary chemical used for
this purpose is 'Proprietary', although a small amount of standard
dish washing detergent can be used in low level experiments.
For the testing with detergent we recommend that you use
no more than 1.5 mL/L of water.
During our continued testing of electrode geometry,
we found a unique method for viewing the ion impact on various
electrode configurations under different polarity connections.
Because of photographic limitations we are only able to show
images captured from electrodes in free air. The images are
faint, yet clear enough to see the actions taking place.
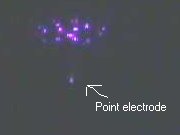
The following images were captured using a 1cm x
1cm Cu plate and a short, smoothed tip #26 gauge Cu wire. The ion
patterns were displayed by using a special material that
fluoresces upon ion impact.
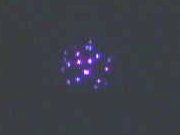
This is a view of the preceding image, looking down
over the point electrode at a slight angle so as to include the
pattern on the target plate. The image does not show well the
pyramid shaped emission from the point to the plate, yet it
spreads from the point towards the plate, creating the pattern
shown.
What should be observed as very interesting is what happens
when only the polarity of the electrodes is changed. In the
following image the point electrode is Positive and the plate is
Ground.

No pattern on the plate electrode is observed. The
ion flow is a direct straight line between the two electrodes.
The next image is photo enhanced to allow the view of the ion
cloud present, just off of the tip of the wire electrode. The
wire electrode is at the bottom of the image and the dot present
at the top is the point where the ion current enters the Cu plate
electrode. It appears that ionization is greatest just off of the
wire tip, yet declines as it moves towards the plate electrode.

{1}All
examples and tests covered in this text were conducted using an
electrolyte of Distilled H20 with an adjusted pH of
7.00, +/- 0.1. Typical brand was Ozarka (Distilled Water),
Purified by Steam Distillation, Carbon Filtration,
Microfiltration and Ozonation.
{2}The spherical “inverse-square” vector field. Valadimir Rojansky,
“Electromagnetic Fields and Waves”; ISBN: 0-486-63834-0
{11}
Purchased from 'The Graphite Store', http://www.graphitestore.com.
Sizes from 0,25" OD to 0.5" OD were used.
|

